Most FluentCart store owners are making pricing, inventory, and marketing decisions based on sales data alone. Sales data tells you what customers bought. It tells you almost nothing about what they wanted but didn’t buy — and that second dataset is frequently more actionable than the first.
Wishlists capture declared purchase intent at the moment it’s expressed. Every time a customer saves a product, they’re leaving a data point that says: I found this, I evaluated it, and I want it — but something stopped me from buying right now. Aggregated across your entire customer base, that signal becomes a detailed picture of where your store has latent revenue sitting unrealized, which products have pricing problems versus demand problems, and which customers are closest to converting at any given moment.
GoWishCart’s analytics features — available in the Pro tier — surface that picture in actionable form. Here’s how to read it and what to do with what you find.
The Four Questions Wishlist Data Answers
Before getting into specific features, it helps to frame what wishlist analytics are actually measuring. There are four questions the data is well-positioned to answer.
What do customers want most? Wishlist save rates, aggregated by product, reveal demand that doesn’t show up in sales figures. A product with 200 wishlist saves and 40 purchases has strong demand. A product with 12 saves and 10 purchases has weak demand but efficient conversion. These are fundamentally different situations that call for different responses.
Where does purchase intent stall? Comparing wishlist rates to purchase rates by product category, price band, or traffic source reveals systematic drop-off patterns. If high-ticket products consistently accumulate saves without converting, that’s a price sensitivity pattern. If a specific category converts well, that’s a merchandising signal worth amplifying.
Which products have price problems? A high save-to-purchase gap is one of the clearest indicators of price resistance in ecommerce. The customer has already done the evaluation — they like the product enough to save it. If they’re not buying, price is the most likely variable. Wishlist analytics make this pattern visible at the product level rather than forcing you to infer it from category-level sales trends.
Who is closest to buying? Customers with recently active wishlists, high wishlist depth, or saved items that have since dropped in price represent a warm segment with a short path to conversion. Wishlist data lets you identify and prioritize that segment for targeted outreach.
GoWishCart Pro Analytics: What’s in the Dashboard
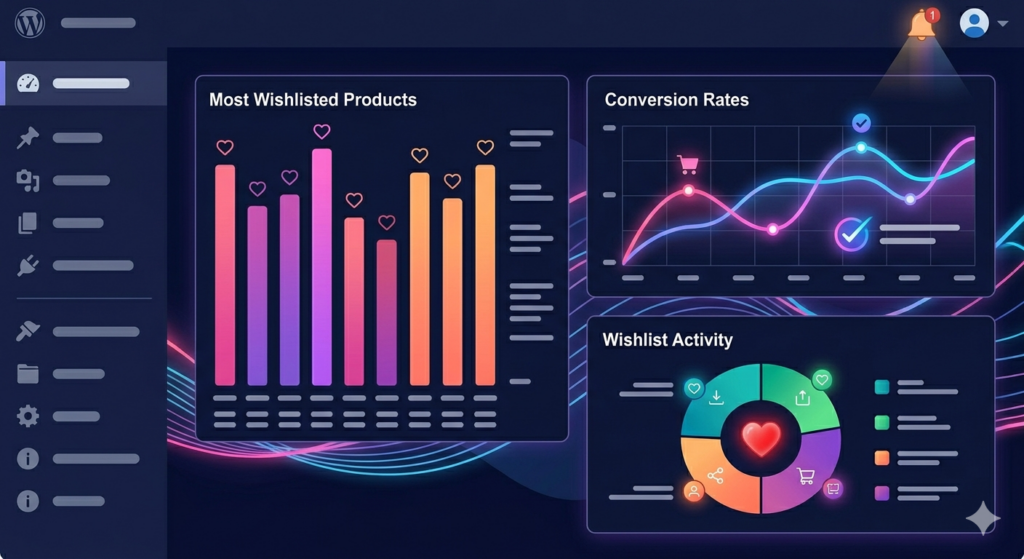
GoWishCart Pro’s analytics dashboard is organized around the metrics that matter most for conversion-focused decision-making.
Most Wishlisted Products. A ranked list of your products by total wishlist saves, with trend data showing whether save rates are increasing or decreasing over a selected time period. This is your demand index — independent of pricing, promotions, or inventory constraints. Products at the top of this list have demonstrated appeal that you can leverage in campaigns, featured placements, and restock prioritization.
Wishlist-to-Purchase Conversion Rate. For each product, GoWishCart tracks the percentage of wishlist saves that result in a purchase, and the median time between save and purchase. This is the metric that separates demand problems from conversion problems. A product with a 40% wishlist-to-purchase rate is converting well. A product with an 8% rate on high save volume has a specific barrier worth identifying.
Save-to-Cart Drop-Off. Beyond the save-to-purchase rate, GoWishCart tracks the intermediate step: saves that result in an add-to-cart action versus saves that never progress. A high drop-off between save and cart suggests the barrier isn’t price — the customer isn’t even initiating the purchase process. This pattern often points to product page issues: weak descriptions, insufficient imagery, missing social proof, or an unclear value proposition.
Removal Analytics. When customers remove a product from their wishlist without purchasing, GoWishCart logs the event. High removal rates on specific products are worth investigating. Removals frequently indicate that the customer found the product elsewhere, that something about the product didn’t hold up on re-evaluation, or that the purchase window passed.
Guest vs. Registered Wishlist Behavior. GoWishCart Pro segments wishlist analytics by user type — registered customers versus guests who provided an email for notifications. Comparing conversion rates between these segments helps you evaluate the business case for encouraging account creation and the effectiveness of your guest capture prompts.
Reading the High-Save, Low-Purchase Signal
The most actionable pattern in wishlist analytics is the high-save, low-purchase product — items with strong demand signals and weak conversion rates. This pattern is worth examining in detail because the correct response depends on diagnosing the underlying cause.
Price sensitivity is the most common cause. If a product consistently attracts saves but not purchases, and its price point is above the median for your catalog, a targeted price test is worth running. Lower the price for a defined period, monitor the conversion rate change, and evaluate whether the margin trade-off is favorable. GoWishCart’s price drop alerts mean that any price reduction automatically notifies the customers most likely to respond — making the test both cleaner and more efficient.
Availability friction is the second common cause. Products that frequently go out of stock accumulate wishlist saves from customers who couldn’t purchase even if they wanted to. High wishlist volume on a product with a history of stockouts is a restock priority signal. It’s also a reorder quantity signal — if 150 customers have an item saved, a restock of 30 units will sell out immediately and the cycle repeats.
Product page quality is the third cause, and the one most store owners overlook. If save rates are high but add-to-cart rates from the wishlist page are low, the product itself is appealing but something in the presentation isn’t closing the sale. This is where removal analytics and save-to-cart drop-off data work together — a product with both high removals and low save-to-cart rates has a presentation problem worth solving before investing in promotional campaigns.
Using FluentCRM with Wishlist Analytics for Targeted Campaigns
Wishlist analytics become significantly more powerful when used alongside FluentCRM’s segmentation and automation tools. The data GoWishCart surfaces tells you what to act on; FluentCRM determines how and when.
Campaign targeting for most-wishlisted products. When you’re planning a promotional sale, most store owners select products based on margin, inventory levels, or gut instinct. Wishlist analytics give you a third input: which products have the largest pool of customers already primed to buy. Running a sale on your top-five most-wishlisted products and activating GoWishCart’s price drop alerts simultaneously creates a campaign with a built-in warm audience. The notification goes to exactly the customers who expressed interest, at exactly the moment the barrier is removed.
Segmenting by wishlist depth for promotional campaigns. In FluentCRM, you can build segments based on GoWishCart’s tagging data — separating customers with five or more wishlisted items from those with one or two. High-depth customers are your most catalog-engaged segment: they respond well to sitewide sales, early access offers, and new product announcements. Single-item wishlist customers respond better to product-specific outreach. The segmentation takes minutes to configure and materially improves campaign relevance.
Re-engagement timing based on wishlist age. GoWishCart tracks when each wishlist entry was created. Items saved more than 30 days ago without a purchase represent a cooling intent signal — not gone, but fading. FluentCRM automation can fire a re-engagement email at the 30-day mark for unsold wishlist items, referencing the specific product and offering a light incentive. This recaptures customers who are drifting toward forgetting your store without requiring a blanket discount to your entire list.
From Analytics to Decisions
The strategic value of wishlist analytics is that they close the feedback loop between customer intent and store management decisions.
Inventory decisions become more accurate when you know which out-of-stock products have active waitlists and how large those waitlists are. Pricing decisions become more evidence-based when you can see save-to-purchase gaps at the product level rather than guessing at price sensitivity from sales trends. Marketing decisions become more efficient when your campaigns are aimed at the customers closest to converting on the specific products they’ve already expressed interest in.
Sales data tells you what already happened. Wishlist analytics tell you what’s about to happen — if you act on the signal correctly.
→ Upgrade to GoWishCart Pro and start making decisions with the full picture of what your customers actually want.